Daily Leverage Certificates
DLC Hotline: (65) 6226 2828
Market Commentary (Hong Kong)
For the week ending 22 September 2023
The US Federal Reserve, SNB, BOE and BOJ paused their rate hikes this week although the Fed signaled that rates would be ‘higher-for-longer’. Hang Seng Index and Shanghai Composite rallied strongly on Friday erasing their losses for this week while the Dow and Nasdaq closed at their weakest in five weeks. Brent Crude and WTI make new year-to-date highs for the fourth consecutive week.
● Shenzhen police have placed several staff from Evergrande’s wealth management subsidiary under criminal investigation.
● China will deepen cooperation with ASEAN with FTA 3.0 in conjunction with RCEP.
● Four Chinese ministries announced a new tax policy to support R&D by semiconductor and industrial machinery enterprises.
● China cut its US Treasury holdings to $821.8 billion in July to a 14-year low.
● Intel was fined 376 million Euros in an EU antitrust case from an infringement nearly twenty years ago.
Hang Seng Index closed this week at 18057, down 125 points or 0.69%. Friday’s trading session did the heavy lifting to erase early week losses by rallying 402 points or 2.28%. Based on the weekly chart, this week’s close showed price action which hinted at support from 18000. This was also evident from last week’s end-of-week performance. The index closed below all of its moving averages except the 10 Day SMA. This setup is associated with further losses.
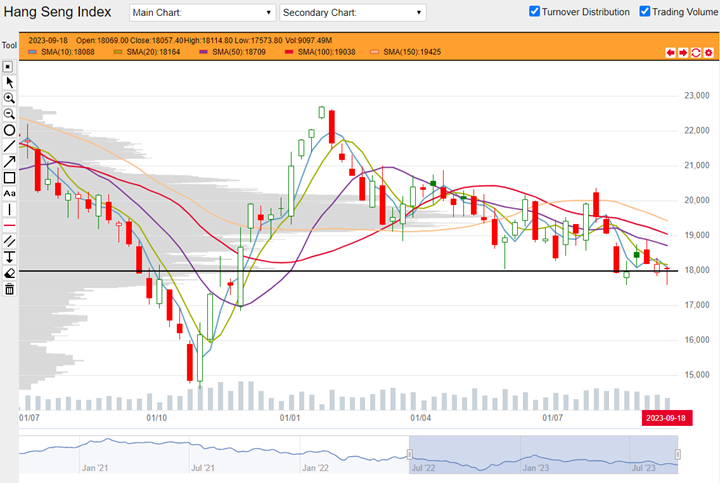
HSI weekly chart from 04 July 2022 to 22 September 2023 (Source: DLC.socgen.com)
Hang Seng Tech closed the week at 3991, down 87 points or 2.12%. Friday’s single day performance was a 142-point rally, up 3.69%. Based on end-of-week candle, there is still some hint of support at 4000. Despite closing the week below this level, the low tail in the candle suggests a struggle to retain the integrity of 4000. HSTech closed below all of its moving average indicators. This is a setup that is associated with further losses.
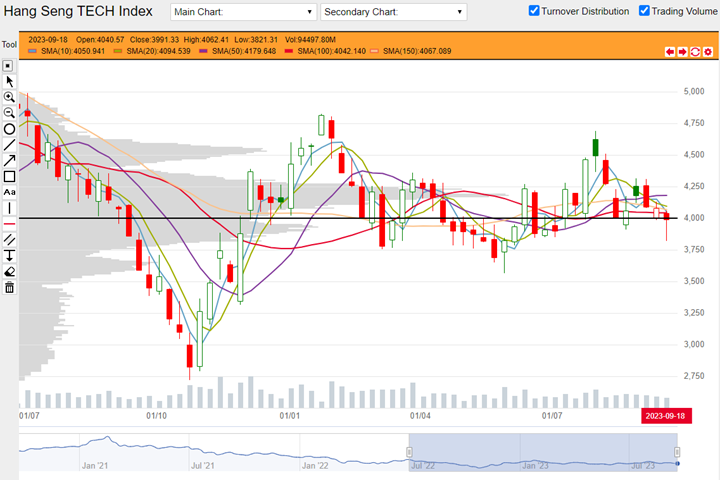
HSTech weekly chart from 04 July 2022 to 22 September 2023 (Source: DLC.socgen.com)
Dow Jones Industrial Average closed at 33964, down 654 points or 1.89%. Nasdaq closed at 14701, down 501 points or 3.30%. The Dow closed at its lowest in 10 weeks while Nasdaq closed at its lowest in 5 weeks. For Dow, the biggest losers are Intel and Home Depot. For Nasdaq the biggest losers for the week are Tesla, Intel, Amazon, AMD and Nvidia. Both indices closed below all of their moving average indicators except the 150 Day SMA.
The next FOMC meeting is scheduled on 01 November 2023.
Fed funds futures on rate hike probability by next Fed meeting as at this week’s close:
● 73.7% probability of no change |26.3% probability of 25 basis points hike
Data indicates a potential peak rate of 6.25% until May 2024. A rate cut could appear as early as March 2024.
Shanghai Composite closed the week at 3132, up 48 points or 1.55%. Shenzhen Index closed at 10179, up 197 points or 1.97%. Shanghai closed above its 10 and 20 Day SMAs. This could be an early signal should there be a reversal but retracements are also not unusual in downtrends. Shenzhen closed below all of its moving averages. This is a setup associated with further losses.
Economic data in coming week:
1. Tuesday 26 September 2023 US releases CB Consumer Confidence.
2. Thursday 28 September 2023 US releases final GDP qoq and Unemployment Claims.
3. Friday 29 September 2023 Fed Chair Powell will speak at a town hall event; US releases revised UoM Consumer Sentiment.
4. Saturday 30 September 2023 China releases Manufacturing and Non-manufacturing PMI data.
Other news:
● AIA, CK Asset, Cosco Ship Holding, Kuaishou, Li Ning, Sinopec, Tencent and Xiaomi bought back shares.
● CK Asset, Ganfeng Lithium, JD.com, Li Ning, Sino Biopharm and Sunny Optical print new 52-week lows.
● CNOOC’s research forecasts China’s natural gas demand for this year to rise by 8% from 2022.
● Cainiao Network Technology, a logistics unit of Alibaba, plans to file for its Hong Kong IPO as early as next week.
● Cosco Ship Holdings announced that it will boost capital at its HK unit to purchase three LNG carriers.
Technical observations
Anta Sports 2020.hk trading near to four-month high, outperforms HSI over same period.
Note chart features:
1. Anta Sports is trading at a four-month high and over the last four weeks, managed to consolidate into a bullish flag-like chart pattern. Since mid-June, there were two prominent swing highs, the one ending in mid-June, closing at a high of $91.55 by the end of the week. Price action over the last four weeks could be a third swing high but could also be consolidating for a higher move. Anta closed at $89.95 at the end of this week. Coincidentally HSI also closed at a swing high in the same mid-June week as Anta. Since that week till date, Anta lost 1.75% while HSI lost 9.84% over the same duration. This outperformance suggests hidden strength in Anta stock.
2. 100 and 150 Day SMA signal that Anta is set up for further losses as there was a dead cross in these indicators back in April this year. These are however long term indicators which tend to lag far behind price action. Anta is also trading above its 10, 20, 50 and 100 Day SMAs. These suggest that a bullish reversal could be in place. Both technical signals contradict so investors need to decide which apply.
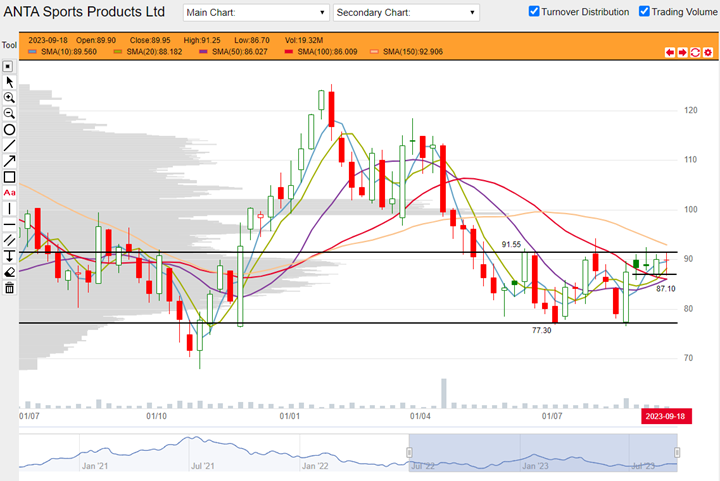
Anta Sports 2020.hk weekly chart from 04 July 2022 to 22 September 2023 (Source: DLC.socgen.com)
Underlying Index/Stock |
Underlying Chg (%)1 |
Long DLC (Bid Change%2) |
Short DLC (Bid Change%2) |
|---|---|---|---|
| Hang Seng Index (HSI) | +0.40% | B00W (+0.86%) | VXRW (-0.35%) |
| Hang Seng TECH Index (HSTECH) | -0.93% | YPCW (-6.25%) | Y9GW (+2.07%) |
| ANTA Sports Products Ltd (2020.HK) | +0.48% | DBPW (0.00%) |
Brought to you by SG DLC Team
This advertisement has not been reviewed by the Monetary Authority of Singapore. This advertisement is distributed by Société Générale, Singapore Branch. This advertisement does not form part of any offer or invitation to buy or sell any daily leverage certificates (the “DLCs”), and nothing herein should be considered as financial advice or recommendation. The price may rise and fall in value rapidly and holders may lose all of their investment. Any past performance is not indicative of future performance. Investments in DLCs carry significant risks, please see dlc.socgen.com for further information and relevant risks. The DLCs are for specified investment products (SIP) qualified investors only.
Full Disclaimer - here